Target efficient support services
Bursarnet.com’s founder Tim Groves pinpoints the significant KPIs across the school campus to show how major savings could be made
The cost of the teaching payroll is obviously the largest expense item in any school. However, the cost of support services will typically vary between 30% (day) to 50% (full boarding) of total costs. Thus, as schools face a considerably more hostile operating environment, it makes sense to ensure the support expenditure is delivering value-for-money. It is also the case that it’s difficult to have a conversation about the efficiency of teaching costs with the head and academic staff without having first nailed the issue of the support spend, and being able to prove it.
Since 2018, I’ve been carrying out a granular benchmarking exercise across the independent school sector, focusing on the material support cost lines, and communicating the results by means of 30 different key performance indicators. Having now assessed more than 130 schools, the pool of data is extensive and sufficient in volume to be able to form conclusions on the differences between the best and worst performers across the major KPIs. The purpose of this article is to focus on several of those KPIs which have a material impact on the bottom line.
FIRST THINGS FIRST
Before diving into the detailed KPIs, it would be useful to make an observation on the compounding effect of different cost increases over time. It was Albert Einstein who commented that: “Compound interest is the eighth wonder of the world. He who understands it, earns it… he who doesn’t… pays it.” As will be shown below, the cost efficiency across schools varies massively (sometimes by several hundred percent) and you might wonder how that can be. Given that most independent schools have been in existence for decades, and often centuries, it follows that their operating model (and its consequent costs) is one which has evolved cumulatively over a long period of time. As per Figure 1, a school which allows a 1% increase in costs every year for 30 years sees its cost base increase by just 34%, whereas a school which allows a 5% increase every year sees its cost base increase by 330%, such is the compounding impact of different cost environments.
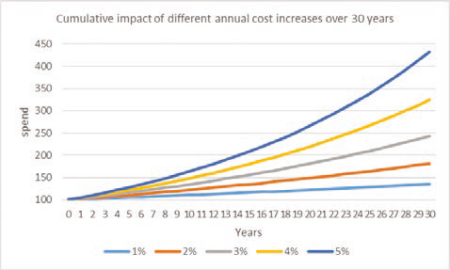
Figure 1
I will now focus on some of the key KPIs which serve to demonstrate the differing performances between those schools already operating leanly, and those where opportunities exist to operate more efficiently.
Space per pupil: This KPI is simply the total square metres of the school-built estate divided by the number of pupils on site. Given how few schools actually know their m2 statistic, this space metric does not appear to be one in common use, and yet the efficiency of how schools use their campus has an obvious impact on the costs per pupil (and thus the fees per pupil required to finance this). Taking the example of day-only schools, most schools fall between 15 and 20m2 per pupil. So the most efficient schools are using two-thirds of the space of the least efficient, and thus those costs which are impacted by the amount of campus space (energy, cleaning, maintenance, insurance, business rates) will weigh more heavily on schools with more generous space ‘allocations’ per pupil.
Recommendation: What’s your space metric? Include this space consideration in future campus developments (are you improving it, maintaining it, or is it deteriorating?).
ENERGY COST PER PUPIL
The total cost of energy per pupil is obviously a function of the price you pay for your energy (pence/kWh), and the amount (volume of kWhs) you use.
Energy prices – The price paid is largely market-driven so you might think “surely we all pay more or less the same?”. And yet if we look at the energy price variability in the seven years pre-June 2021 (when energy markets started to increase dramatically as demand picked up post-Covid), Figure 2 demonstrates just how much the underlying wholesale energy pricing can vary, both within any given year, but also across the years (it doesn’t always go up).

Figure 2
Being savvy about when you renew, and how long you commit for, can pay big dividends. In my benchmarked schools, the best performers are undoubtedly those that approach energy buying strategically, and this means that energy decisions are personally dealt with by the bursar/chief operating officer (not delegated to junior finance or estates staff ), and such decisions are carefully planned for long in advance (not just when the old contract expires).
A key strategic consideration in energy buying is also the choice of advisor. Unfortunately, the independent school sector is dominated by energy brokers that are paid recurring commissions by your energy suppliers on every kWh you consume, but unseen and normally unauthorised by you. I believe this is a
potential conflict of interest – the higher the price, the longer the contract, the more the broker earns. This may explain why I have found schools taking out inexplicably long contracts at moments of high market pricing.
Recommendation: Do you know how your energy advisor is being paid? If you’re not paying them, your supplier is! Find a strategic advisor prepared to work on a direct charging model, with zero commissions. Work with them on a long- term energy procurement plan. Diarise when your energy contracts renew, and start renewal planning 12 months ahead.
Energy volumes (usage) – The benchmarking process allows me to collect the energy volumes used by participating schools and thereby calculate the carbon footprint per pupil. The results for the pure ‘all-years’ day schools (no boarders) is shown in Figure 3. It can be seen that the average of the first quartile performers (0.13 tons per pupil per annum) is so much more efficient than those in the fourth quartile (0.30) – that is, the least efficient are using 2.3 times more energy than their most efficient peers. Ordinarily this will translate into a correspondingly higher energy bill.
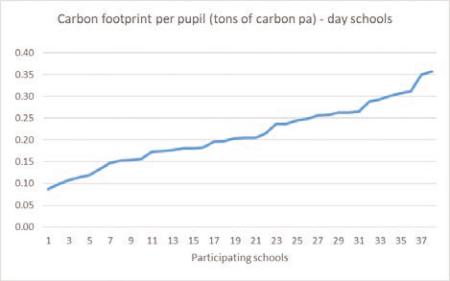
Figure 3
Clearly, those in the first quartile will probably be those with less space per pupil to both heat and light, but it’s not just down to space. Neither can this performance be explained by old versus modern campuses – all these large day schools have a mixture of old historic buildings, with more recent additions. The data simply shows that those schools which have sensibly addressed their energy usage over the long term have progressively become more energy-efficient.
Recommendation: While energy- efficiency measures can be a real money pit, my impression is that the better performers have focused on the basic disciplines of cutting wasteful usage and improving insulation within the normal cycle of estate refurbishment. What’s your carbon footprint per pupil? If in the third/fourth quartiles, there will be material gains to be made here without necessarily spending large amounts of unplanned capex.
CLEANING
The cost of cleaning is always a large sum of money, and yet from within the confines of the school it’s hard to assess whether the cost incurred represents good value for money. My preferred KPI is total cleaning cost (labour and materials) per square metre of built estate, on the basis that all areas of the school estate will receive some measure of cleaning. Figure 4 shows the range of values obtained across the ‘all-years’ and senior schools, where again, the difference between the first quartile and fourth quartile averages is plus-230% (£11.2/m2 versus £25.8/m2).

Figure 4
In the vast majority of cases I have encountered, the cleaning function is carried out in-house. Interestingly, and counterintuitively, those 5% that have outsourced this function are all in the first/second quartiles (after paying contractor profit plus VAT). This is not to recommend that schools should outsource their cleaning, but simply evidence that the professionalisation ofthe cleaning function leads to significant efficiencies. Increasing the management, skills and equipment of the cleaning team can also occur in-house.
Recommendation: What’s your cleaning KPI? If materially adrift it would be worth commissioning a ‘time and motion’ study of the cleaning function from experts in the field.
MAINTENANCE PER SQUARE METRE
This KPI looks at what is normally the largest area of school operating expenditure after the teacher payroll. It comprises both the staff and non-staff spend across the maintenance function (excluding grounds), divided by the m2 of the built estate. It obviously excludes any capital projects.
As can be seen from Figure 5, the range of values is even more pronounced, where the fourth quartile average (£48.8/m2) is 250% higher than the first quartile average (19.6/m2). If we recognise that some of those in the first quartile are certainly under-spending due to budget constraints, and some of those in the fourth quartile are having to play expensive catch-up (it’s always more expensive to fix after it’s broken), and thus this 250% range is potentially misleading, even the range between second and third quartiles is revealing (£29.8/m2 versus £38.4/m2, that is, plus-30%).
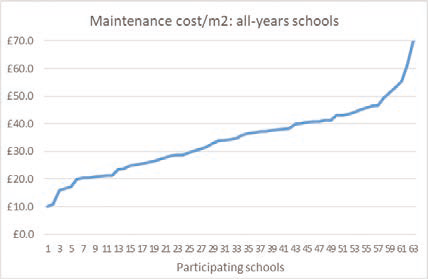
Figure 5
Having carried out a significant number of subsequent ‘deep-dive’ assignments into how efficiently estates departments are run it’s clear that in general the estates department within schools is often under- developed, under-skilled, and focusing too much on the day-to-day ‘reactive’ responses at the expense of longer-term planning (‘proactive’). The upside of this assessment, however, is that there are significant gains to be made in improving the function of the estates team. As an example, if a typical all-years day school has an estate of around 20,000m2, improving its position from the third to the second quartile is worth £170,000 per annum.
Recommendation: Is your estates department reactive or proactive? If you consider that your current budget represents normal course of business, what quartile are you in? If third or fourth quartile, consider engagingwith an expert on how to improve performance.
CONCLUSION
As the above shows, in just three key operating areas (energy, cleaning, maintenance), there are very significant differences between the best and worst performers. The same kind of differences also exist in other large spend items (catering, IT and photocopying, grounds, academic budgets, marketing and administrative functions.)
It’s generally the case that schools in more challenging geographical locations can be expected to be first or second quartile for the big-ticket items, probably because the reality of their parental finances has meant that they’ve had to exercise tight cost control for decades. By contrast, those schools within affluent areas will often be third or fourth quartile, probably because they haven’t faced the same pressures.
What the above, and the full range of benchmarking results both show, is that it’s worth being curious about your own support services KPIs, and tracking how they evolve from one year to the next. There are material sums to be gained by working to improve the efficiency of those KPIs where the school is off the pace of its peers. Improving many of these KPIs is not contingent on spending additional monies, but it does require staff of appropriate seniority and experience to have bandwidth to spend quality time on the issues, sometimes at very precise moments in time, such as contract renewals.